Summary: Max Temperature
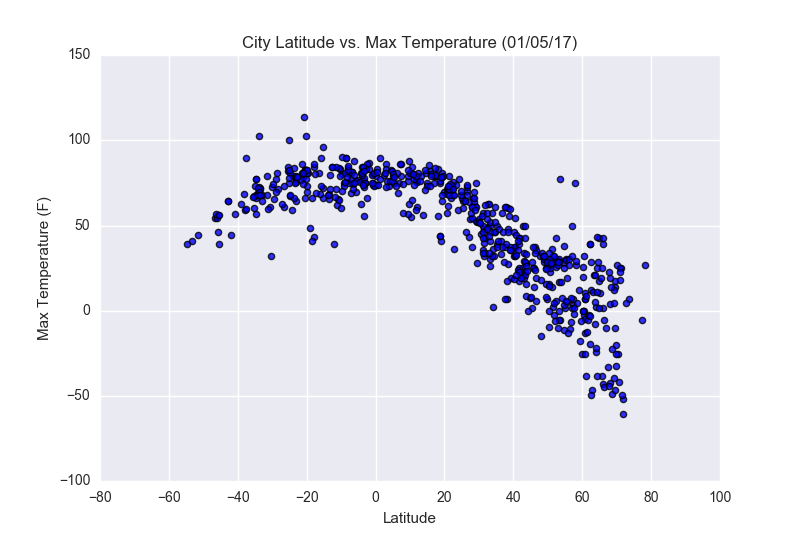
Our analysis of the relationship between City Latitude and Max Temperature found, as predicted, that there is a strong correlation between a city's
maximum temperature and its proximity to the equator. As latitudes decrease; e.g. we look at cities closer to the equator in both the northern and
southern hemispheres; we find that cities' maximum temperatures increase.